Trends in migration show that more and more people are moving to cities and larger towns, leading to an expected increase in air pollution in urban areas. However, it is encouraging to see a rise in public awareness about the importance of air quality and the government’s efforts to raise the nation’s consciousness through various projects.
A concerning statistic is that more than 63 million Americans live in counties with high spikes in daily particle pollution. The same research indicates that 24 of the 25 worst cities for short-term particle pollution are in the western US.
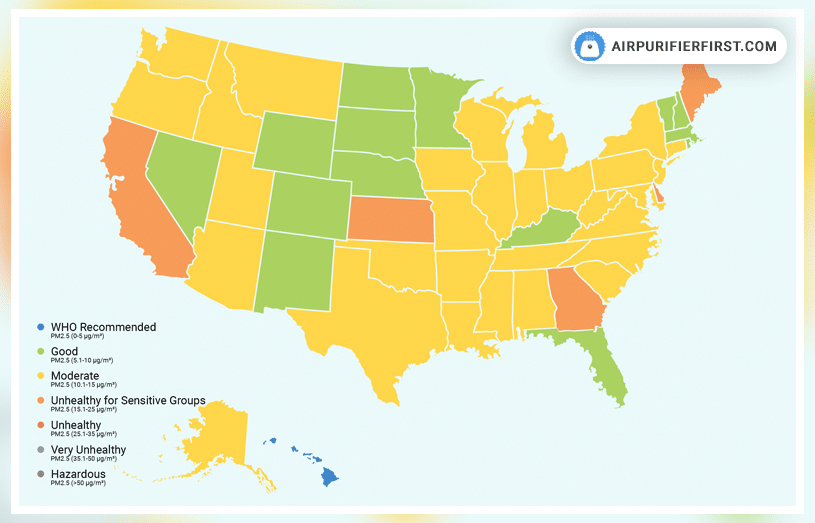
Table of Contents
According to the EPA, short- and/or long-term exposure to air pollution has been associated with a wide range of human health effects, including increased respiratory symptoms, hospitalization for heart or lung diseases, and even premature death.
But what exactly is air pollution, and how is it measured? The World Health Organization (WHO) defines air pollution as the contamination of indoor or outdoor environments by any chemical, physical, or biological agent that alters the natural characteristics of the atmosphere. Common sources of air pollution include household combustion devices, motor vehicles, industrial facilities, and forest fires. Pollutants of major public health concern include particulate matter, carbon monoxide, ozone, nitrogen dioxide, and sulfur dioxide. The most commonly tracked air pollutant is PM2.5, which is primarily why this research focuses on the most polluted cities in the US by average particulate matter pollution in a year.
Surprising Insights on America’s Most Polluted Cities Revealed!
- More than 30 of the most polluted cities in the US have moderate air quality, if counted one per state.
- Honolulu, Hawaii, is the only city with air quality under WHO-recommended ratings, making Hawaii the least polluted of the most polluted states in the US.
- Five cities have unhealthy air quality for certain groups, meaning people with pre-existing health conditions such as heart disease, lung disease (like asthma, emphysema, and bronchitis), or diabetes are at high risk in these cities.
- Neither of the most polluted cities in the world is in the US.
- The most polluted city in the US is almost three times less polluted than Lahore, Pakistan, the most polluted city in the world.
- The most polluted city in the US ranks 381 places behind the most polluted city in the world.
- Eight of the top 10 most polluted cities in the US are in California.
- Wildfire season is part of the year when the air in the US is the most polluted. To avoid potential affects on your health, it is best to avoid visiting California, Washington, and Oregon states during the wildfire season.
Criteria for Identifying the Most Polluted Cities
In this research, we used data from the IQAir air quality map as a reference and main source to determine the most polluted cities in the US.
Most of the data presented on IQAir is aggregated in real-time (on an hourly basis). Some percent of data is from government monitoring stations, while the other PM2.5 data are included from a selection of crowdsourced, public, and validated outdoor IQAir AirVisual PM2.5 monitoring stations, many of which provide the public, real-time air quality readings within their communities.
The fact is that these and similar monitors aren’t only located in cities but also in smaller towns, communities, and places with populations of 100-200 people or even fewer. Therefore, we established one of the fundamental criteria for this study as considering only cities or towns with a minimum population of 5,000.
The second criterion is that we only look at the concentration of PM2.5 μg/m³ particles on average over a year. By focusing on these criteria, our research aimed to identify the most polluted urban areas in the United States.
This approach allowed us to ensure that the data collected was representative of larger populations while also considering the significance of PM2.5 pollution, which is known to have adverse effects on human health and the environment.
The Most Polluted Cities in the US – One Per State
This research represents an analysis of 3,189 cities in the US; 2,143 of these cities reported data from only non-government-operated monitors, while 477 reported data from government air quality stations. Each of these sensors measures real-time data on current air quality, reporting information on the current amount of PM2.5 particles in the air.
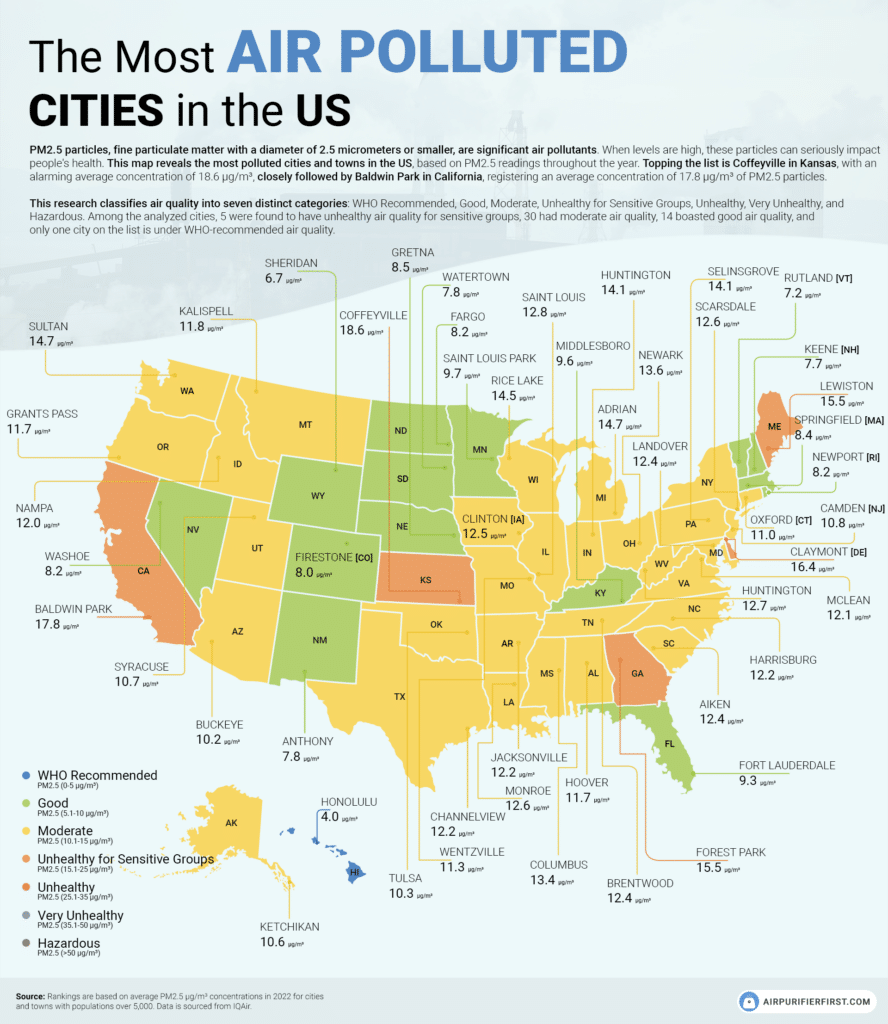
By analyzing cities in the US and following the criteria that every location on the list must have more than 5,000 inhabitants, we have identified the most polluted cities in the US, but only one city/town per US state.
The overall most polluted city in the US is Coffeyville in Kansas, with an average concentration of 18.6 μg/m³ of PM2.5 particles. Interestingly, in 2021 this city had an average concentration of PM2.5 particles of 19.8 μg/m³, which means that in 2022 the air quality in this city generally improved by around 6%. This trend is encouraging, and if it continues, Coffeyville may no longer appear on the list of most polluted cities in the US.
Just after Coffeyville, the second most polluted place is Baldwin Park in California, with an average concentration of 17.8 μg/m³ of PM2.5 particles. The air quality at this location has also improved from 2021 but by a slightly smaller percentage of around 5.3%. One notable observation is that air quality during the wildfire smoke season is the most polluted throughout almost all of California, not just in Baldwin Park. Essentially, this period contributes to the poor air quality in Baldwin Park and similar locations.
Regarding the “State of the Air” study, out of the top 10 most polluted cities in the US, eight are in California. Accordingly, it would be great to avoid visiting California, Washington, and Oregon states during wildfire season, as these states are extremely polluted at that time of the year due to increasing wildfires. In California alone, 7,490 wildfires were detected in 2022, resulting in 362,455 acres burned.
Share this map created by AirPurifierFirst.com on your website:
<a href='https://www.airpurifierfirst.com/blog/most-polluted-cities-in-the-us/'><img src='https://www.airpurifierfirst.com/wp-content/uploads/2023/03/The-Most-Air-Polluted-Cities-and-Towns-in-the-US-Map-Hi-Res.png' alt='Map of the most air-polluted cities and towns in the US by Airpurifierfirst.com' width='800px' border='0' style='display: block' /></a><p>Infographic created by: <a href='https://www.airpurifierfirst.com/' target='_blank'>Air Purifier First</a></p>In the detailed map above, you can see the rankings of each state’s most polluted cities/towns.
Another interesting point to emphasize is that, out of all the most polluted states, Hawaii is the least polluted. Specifically, Honolulu has an average concentration of PM2.5 particles of just 4 μg/m³, which is within the value recommended by the World Health Organization (WHO).
What are PM2.5 particles?
Particulate matter, one of six US EPA criteria air pollutants, is a mixture that may contain organic chemicals, dust, soot, and metals. PM2.5 refers to particulate matter that is 2.5 micrometers or smaller in diameter, about 3% of the diameter of a human hair. These particles are so tiny that they can only be detected using an electron microscope.
| # | Color Code | PM2.5 |
|---|---|---|
| WHO Recommended | Blue | 0-5 μg/m³ |
| Good | Green | 5.1-10 μg/m³ |
| Moderate | Yellow | 10.1-15 μg/m³ |
| Unhealthy for Sensitive Groups | Orange | 15.1-25 μg/m³ |
| Unhealthy | Red | 25.1-35 μg/m³ |
| Very Unhealthy | Purple | 35.1-50 μg/m³ |
| Hazardous | Maroon | 50 μg/m³ |
IQAir uses the following table to determine the concentration of μg/m³ (micrograms per cubic meter) that indicates air quality across seven different scales. An ideal amount of PM2.5 particles in the air is 4 μg/m³, as the World Health Organization (WHO) suggested, but concentrations up to 10 μg/m³ are still acceptable and should not affect people’s health.
Conclusion
The modern and fast-paced lifestyle is leading us to produce more and more pollution globally, and it is challenging to resist this trend. However, some exceptional initiatives support raising awareness about air pollution and finding the most effective ways to combat it.
For example, the “Clean Air Act” is an initiative that was projected to prevent over 230,000 deaths and save around $2 trillion in 2020. This act has been responsible for air quality improvements in the US for decades. This may be the reason why the US is rarely found on the list of the most polluted locations in the world.
As an individual, you can join various initiatives in your local community or even at the state level to raise awareness and fight against air pollutants.
In addition, air purifiers reduce indoor air pollution, so investing in such a device can be a great start to improving air quality, at least inside your home.
Sources
Short-Term Particle Pollution Trends – lung.org
Managing Air Quality – Human Health, Environmental and Economic Assessments – epa.gov
Ambient (outdoor) air pollution – who.int
Most Polluted Places to Live – lung.org
World’s most polluted cities (historical data 2017-2022) – iqair.com
Air quality and pollution city ranking – iqair.com
Fine particulate matter exposure during childhood relates to hemispheric-specific differences in brain structure – sciencedirect.com
2022 Wildfires Incident Archive – fire.ca.gov
Criteria Air Pollutants – epa.gov
Summary of the Clean Air Act – epa.gov
Air Quality Monitor – airpurifierfirst.com
State of the Air – lung.org
Leave a Reply